Category: Business – Skills, Knowledge, News, Buy & Sell

Sell Business, Commercial Broker, Commercial Realtor, Business Realtor Restaurant, Coffee Shop, Grocery Store, Convenience Store, Super Market, Market, Hotel, Motel, Bar, Pub, Fast Food, Golf Course, Winery, Wine Yard, Farm, Clinic, Bubble Tea Business Broker – Buy Business, Business Realtor, Commercial Realtor, Business Broker Restaurant, Coffee Shop, Grocery Store, Convenience Store, Super Market, Market, Hotel, Motel, Bar, Pub, Fast Food, Golf Course, Winery, Wine Yard, Farm, Clinic, Bubble Tea

Business Consulting – Startup, E-Commerce, Digital Marketing, Profit Coach
Wordpress, WooCommerce, Online Store, Affiliate Marketing, Multiple Level Marketing, CRM, Coupon System, Store Credit, Gift Card

  • Canada’s July Labour Force Survey Was the Weakest Since 2022

    Canada’s July Labour Force Survey Was the Weakest Since 2022

    Canada’s July Labour Force Survey Was the Weakest Since 2022
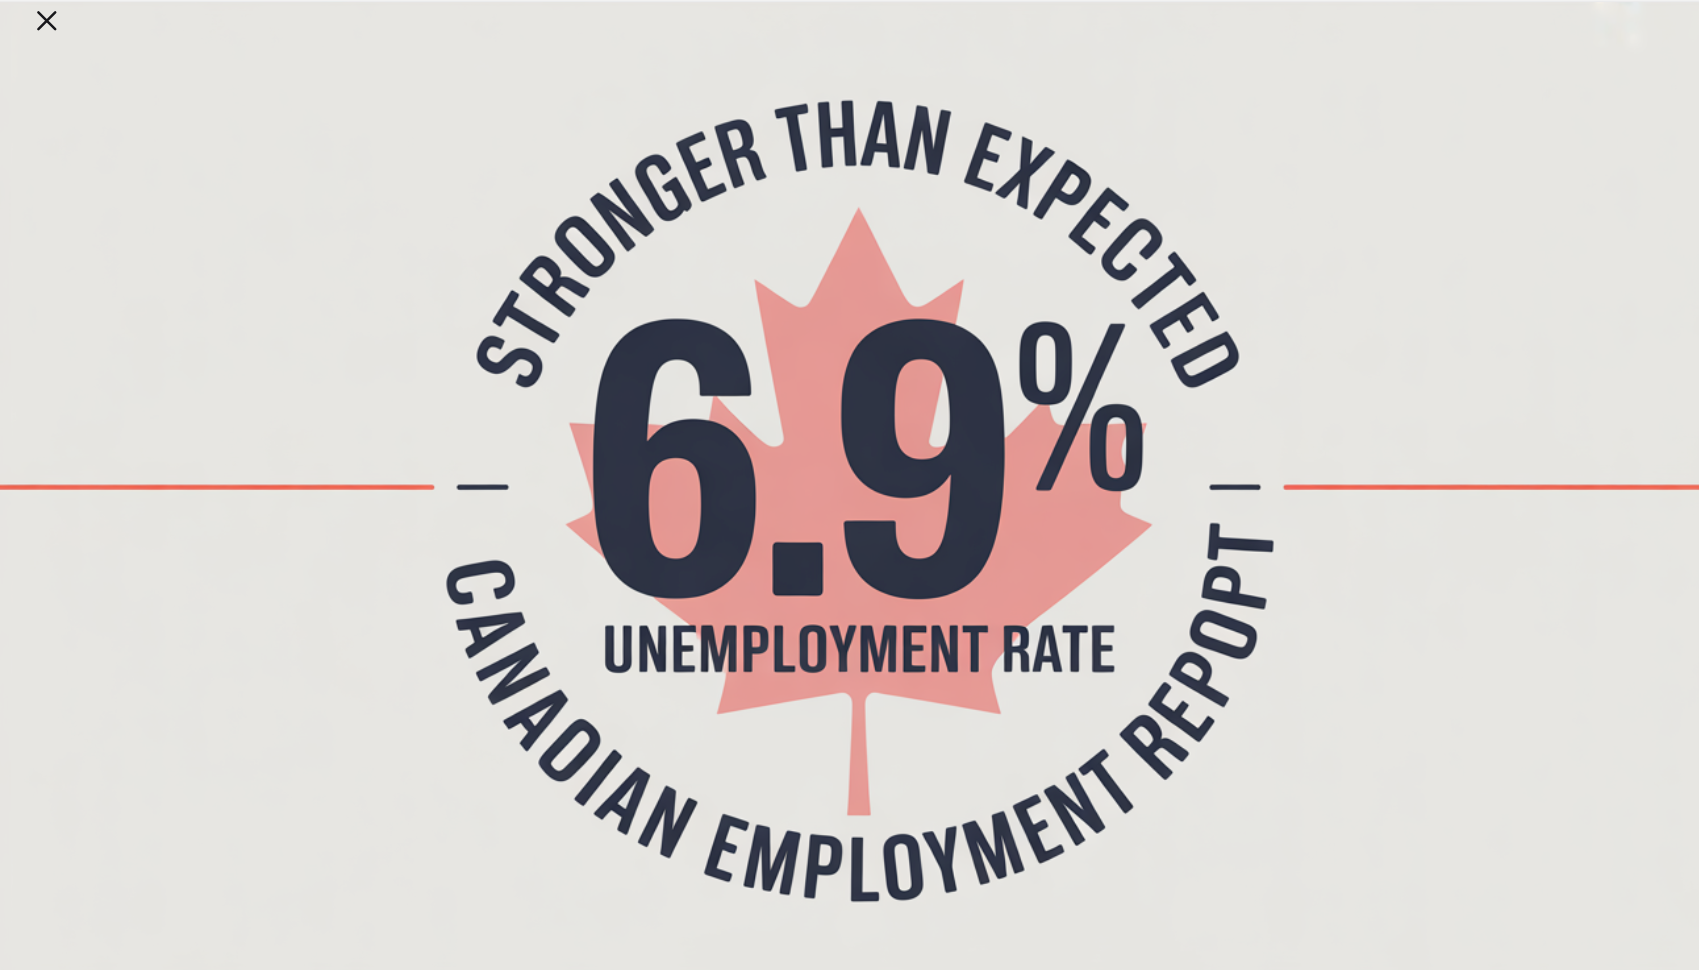
    Employment fell by 40,800 jobs in July, a weak start to the third quarter, driven by decreases in full-time work, with most of the decline in the private sector. The jobless rate held steady at 6.9%, even though the number of unemployed people fell. The monthly decline was the largest since January 2022, and excluding the pandemic, it’s the most significant drop in seven years. 

    The job loss was concentrated among youth ages 15 to 24 who have had a terrible time finding summer jobs this year. The unemployment rate for that group is a whopping 14.6%, the highest since September 2010 outside of the pandemic. The youth employment rate fell 0.7 percentage points to 53.6% in July—the lowest rate since November 1998, excluding the pandemic. 

    Trump’s tariff turmoil has halted so many crucial financial decisions. Potential homebuyers are deer-in-the-headlights despite the relatively low mortgage rates, strong supply of unsold homes, and lower prices. Potential move-up buyers similarly don’t take action despite the relatively strong bargaining power of buyers. 
    The employment rate—the proportion of the population aged 15 years and older who are employed—fell by 0.2 percentage points to 60.7% in July and was down 0.4 percentage points from the beginning of the year (61.1% in both January and February).

    The number of employees in the private sector fell by 39,000 (-0.3%) in July, partly offsetting a cumulative gain of 107,000 (+0.8%) in May and June. There was little change in the number of public sector employees and in the number of self-employed workers in July.
    The unemployment rate held steady at 6.9% in July, as the number of people searching for work or on temporary layoff varied little from the previous month. The unemployment rate had trended up earlier in 2025, rising from 6.6% in February to a recent high of 7.0% in May, before declining 0.1 percentage points in June.

    Unemployed people continued to face difficulties finding work in July. Of the 1.6 million people who were unemployed in July, 23.8% were in long-term unemployment, meaning they had been continuously searching for work for 27 weeks or more. This was the highest share of long-term unemployment since February 1998 (excluding 2020 and 2021).

    Compared with a year earlier, unemployed job seekers were more likely to remain unemployed from one month to the next. Nearly two-thirds (64.2%) of those who were unemployed in June remained unemployed in July, higher than the corresponding proportion for the same months in 2024 (56.8%, not seasonally adjusted).

    Despite continued uncertainty related to tariffs and trade, the layoff rate was virtually unchanged at 1.1% in June compared with a year ago (1.2%). This measures the proportion of people who were employed in June but were laid off in July. In comparison, the layoff rate for the corresponding months from 2017-19, before the pandemic, averaged 1.2%.

    There were fewer people in the labour force in July as many discouraged workers dropped out, and the participation rate—the proportion of the population aged 15 and older who were employed or looking for work—fell by 0.2 percentage points to 65.2%. Despite the decrease in the month, the participation rate was little changed on a year-over-year basis.

    Despite continued uncertainty related to tariffs and trade, the layoff rate was virtually unchanged at 1.1% in July compared with 12 months earlier (1.2%). This represents the proportion of people who were employed in June but had become unemployed in July as a result of a layoff. In comparison, the layoff rate for the corresponding months from 2017 to 2019, before the pandemic, averaged 1.2% (not seasonally adjusted).

    There were fewer people in the labour force in July, and the participation rate—the proportion of the population aged 15 and older who were employed or looking for work—fell by 0.2 percentage points to 65.2%. Despite the decrease in the month, the participation rate was stable on a year-over-year basis.

    Employment declined in information, culture and recreation by 29,000 (-3.3%). In construction, employment decreased by 22,000 (-1.3%) in July, following five consecutive months of little change. The number of people working in construction in July was about the same as it was 12 months earlier.

    Employment fell in business, building and other support services (-19,000; -2.8%), marking the third decline in the past four months for the industry. Employment also fell in health care and social assistance (-17,000; -0.6%), offsetting a similar-sized increase in June. Compared with 12 months earlier, employment in health care and social assistance was up by 54,000 (+1.9%) in July.

    Employment rose in transportation and warehousing (+26,000; +2.4%) in July, the first increase since January. On a year-over-year basis, employment in this industry was little changed in July.

    The number of jobs declined in Alberta (-17,000; -0.6%) and British Columbia (-16,000; -0.5%), while it increased in Saskatchewan (+3,500; +0.6%). There was little change in the other provinces.
    Total hours worked in July were little changed both in the month (-0.2%) and compared with 12 months earlier (+0.3%).

    Average hourly wages among employees increased 3.3% (+$1.17 to $36.16) on a year-over-year basis in July, following growth of 3.2% in June (not seasonally adjusted).
    Employment also declined in May in transportation and warehousing (-16,000; -1.4%); accommodation and food services (-16,000; -1.4%), and business, building and other support services (-15,000; -2.1%).
     
    Bottom Line

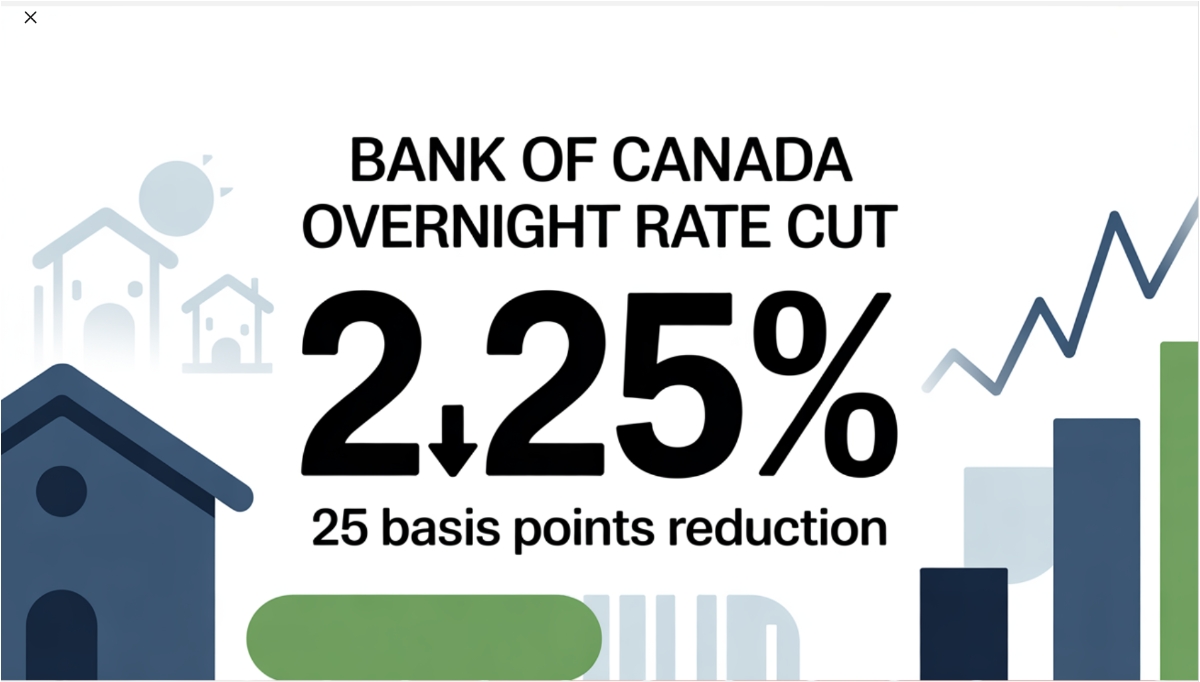
    The two-year government of Canada bond yield fell about four bps on the news, while the loonie weakened. Traders in overnight swaps fully priced in a quarter-point rate cut by the Bank of Canada by year-end, and boosted the odds of a September cut to about 40%, from 30% previously. 

    Oddly enough, manufacturing payrolls rose in July despite the tariffs. This was the second consecutive monthly gain for a sector that one would expect to be most affected by the trade war. Manufacturing employment has fallen year-over-year.

    This was an unambiguously weak report, but it comes hard on the heels of a robust report. Averaging the two months of data suggests there is an excess supply in the economy. But we will need to see a decline in core inflation for the Bank of Canada to resume cutting interest rates. 

    Traders are now expecting the US central bank to cut interest rates when it meets again in September. With any luck at all, this will pressure the Bank to cut rates as well, but only if the interim two inflation reports show an improvement, and the labour market remains weak. The next jobs report is on September 5, and the Bank of Canada meets again on September 17. 
    Dr. Sherry Cooper
  • Case Study: How Debt Restructuring Can Save You Thousands

    Case Study: How Debt Restructuring Can Save You Thousands

    When you’re juggling multiple loans and high-interest debts, Debt Restructuring can be the financial strategy that brings relief—and significant savings. For many homeowners and buyers in the Vancouver real estate market, understanding how to restructure debt is not just about reducing monthly payments; it’s about creating long-term financial stability.


    Debt Restructuring Explained

    Debt Restructuring is the process of consolidating or reorganizing your existing debts—such as a first mortgage, second mortgage, or credit card balances—into a single, more manageable loan. This often means replacing high-interest debts with one loan at a lower rate, which can save you a substantial amount of money over time.

    For example, instead of paying off several loans at different rates and due dates, you merge them into one loan with a fixed repayment plan. This simplifies budgeting, reduces stress, and helps avoid missed payments.


    Case Study 1: First and Second Mortgage Consolidation

    Imagine you have a first mortgage at 4.9% and a second mortgage at 9.5%. Paying these separately may feel manageable month-to-month, but over the long term, the extra interest on the second mortgage adds up quickly.

    Through Debt Restructuring, you could merge both mortgages into a single loan at, say, 5.5%. While the new rate may be slightly higher than your first mortgage’s rate, it’s much lower than the second mortgage’s rate. The result: you pay less interest overall and simplify your repayment schedule.


    Case Study 2: Adding Credit Card Debt to the Mix

    Now let’s take it a step further. Suppose you have the same first and second mortgages, plus credit card debt at 19.9% interest. By consolidating all three into one restructured mortgage, you replace high-interest revolving debt with a lower fixed rate. This not only reduces your monthly payment but also helps you pay down your debt faster since more of your payment goes toward the principal rather than interest.


    Why Debt Restructuring Matters for Real Estate Buyers and Sellers

    If you’re a home buyer, debt restructuring can improve your credit profile, making it easier to qualify for better mortgage terms. For home sellers, clearing high-interest debt before listing your property may improve your financial flexibility, allowing you to handle closing costs or invest in home staging.

    In a high-cost housing market like Vancouver, these savings can make the difference between feeling financially stretched and maintaining stability. For insights on broader market trends that affect borrowing costs, check out this recent report:
    Today’s Report Shows Inflation Remains a Concern, Forestalling BoC Action.


    A Smart Move: Pair Debt Restructuring with Property Risk Checks

    When you’re making big real estate decisions, understanding your financial position is only half the equation. It’s also important to understand the property you’re buying. Services like EstateDetect.com specialize in investigating potential risks and uncovering opportunities before you commit to a purchase, giving you peace of mind.


    Final Thought:
    Debt Restructuring isn’t just a way to lower payments—it’s a long-term strategy for financial health. By learning how to consolidate loans effectively, you can save thousands in interest and simplify your path toward debt freedom. For more real estate and finance insights, visit MorningLee.ca.

    Case Study: How Debt Restructuring Can Save You Thousands
  • Today’s Lowest Mortgage Rates

    Today’s Lowest Mortgage Rates

    Dropped! Finally dropped! We can see 3.99% now for 3-Year fixed rates.

  • Bank of Canada Holds Rates Steady As Tariff Turmoil Continues

    Bank of Canada Holds Rates Steady As Tariff Turmoil Continues

    Bank of Canada Holds Rates Steady As Tariff Turmoil Continues
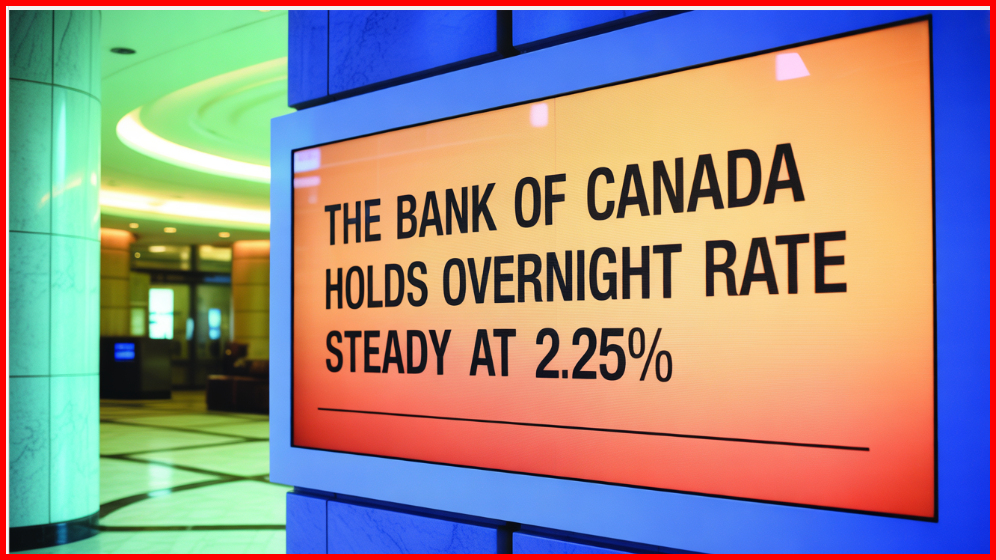
    As expected, the Bank of Canada held its benchmark interest rate unchanged at 2.75% at today’s meeting, the third consecutive rate hold since the Bank cut overnight rates seven times in the past year. The Governing Council noted that the unpredictability of the magnitude and duration of tariffs posed downside risks to growth and lifted inflation expectations, warranting caution regarding the continuation of monetary easing.

    Trade negotiations between Canada and the United States are ongoing, and US trade policy remains unpredictable.

    While US tariffs are disrupting trade, Canada’s economy is showing some resilience so far. Several surveys suggest consumer and business sentiment is still low, but has improved. In the labour market, we are seeing job losses in the sectors that rely on US trade, but employment is growing in other parts of the economy. The unemployment rate has moved up modestly to 6.9%.

    Inflation is close to the BoC’s 2% target, but evidence of underlying inflation pressures continues. “CPI inflation has been pulled down by the elimination of the carbon tax and is just below 2%. However, a range of indicators suggests underlying inflation has increased from around 2% in the second half of last year to roughly 2½% more recently. This largely reflects an increase in prices for goods other than energy. Shelter cost inflation remains the biggest contributor to CPI inflation, but it continues to ease. Surveys indicate businesses’ inflation expectations have fallen back after rising in the first quarter, while consumers’ expectations have not come down”.

    The Bank asserted today that there are reasons to think that the recent increase in underlying inflation will gradually unwind. The Canadian dollar has appreciated, which reduces import costs. Growth in unit labour costs has moderated, and the economy is in excess supply. At the same time, tariffs impose new direct costs, which will be gradually passed through to consumers. In the current tariff scenario, upside and downside pressures roughly balance out, so inflation remains close to 2%.

    The central bank provided alternative scenarios for the economic outlook. In the de-escalation scenario, lower tariffs improve growth and reduce the direct cost pressures on inflation. In the escalation scenario, higher tariffs weaken the economy and increase direct cost pressures.

    So far, the global economic consequences of US trade policy have been less severe than feared. US tariffs have disrupted trade in significant economies, and this is slowing global growth, but by less than many anticipated. While growth in the US economy looks to be moderating, the labour market has remained solid. And in China, lower exports to the United States have largely been replaced with stronger exports to other countries. 

    In Canada, we experienced robust growth in the first quarter of 2025, primarily due to firms rushing to get ahead of tariffs. In the second quarter, the economy looks to have contracted, as exports to the United States fell sharply—both as payback for the pull-forward and because tariffs are dampening US demand.

    The gap between the 2.75% overnight policy rate in Canada and the 4.25-4.50% policy rate in the US is historically wide. Another cause of uncertainty is the fiscal response to today’s economic challenges. The One Big Beautiful Bill has passed, and it will add roughly US$4 trillion to the already burgeoning US federal government’s red ink. This has caused a year-to-date rise in longer-term bond yields, steepening the yield curve. 

    The slowdown of the housing sector since Trump’s inauguration has been a substantial drain on the economy.  The Monetary Policy Report (MPR) for July states that “growth in residential investment strengthens in the second half of 2025, partially due to an increase in resale activity after the steep decline in the first half of the year. Growth in residential investment is moderate over 2026 and 2027, supported by dissipating trade uncertainty and rising household incomes.”
    Bottom Line

    We expect the Canadian economy to post a small negative reading (-0.8%) in Q2 and (-0.3%) in Q3, bringing growth for the year to 1.2%. The next Governing Council decision date is September 17, which will give the  Bank time to assess the underlying momentum in inflation and the dampening effect of tariffs on economic activity. 

    If inflation slows over the next couple of months and the economy slows in Q2 and Q3 as widely expected, the Bank will likely cut rates one more time this year, bringing the overnight rate down to 2.50%, within the neutral range for monetary policy. Bay Street economists have varying views on the rate outlook (see chart above). While the Fed will hold rates steady today, despite the incredible pressure coming from the White House, the Bank of Canada could well cut rates one more time this year.  
    Dr. Sherry Cooper

    Chief Economist, Dominion Lending Centres
  • Today’s Report Shows Inflation Remains a Concern, Forestalling BoC Action

    Today’s Report Shows Inflation Remains a Concern, Forestalling BoC Action

    Today's Report Shows Inflation Remains a Concern, Forestalling BoC Action

    Canadian consumer prices accelerated for the first time in four months in June, and underlying price pressures firmed, likely keeping the central bank from cutting interest rates later this month.

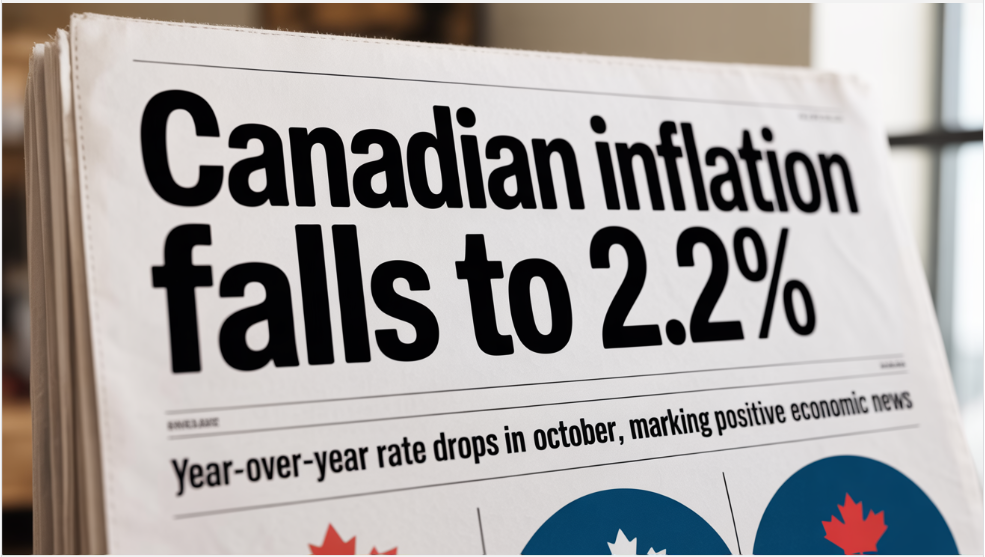
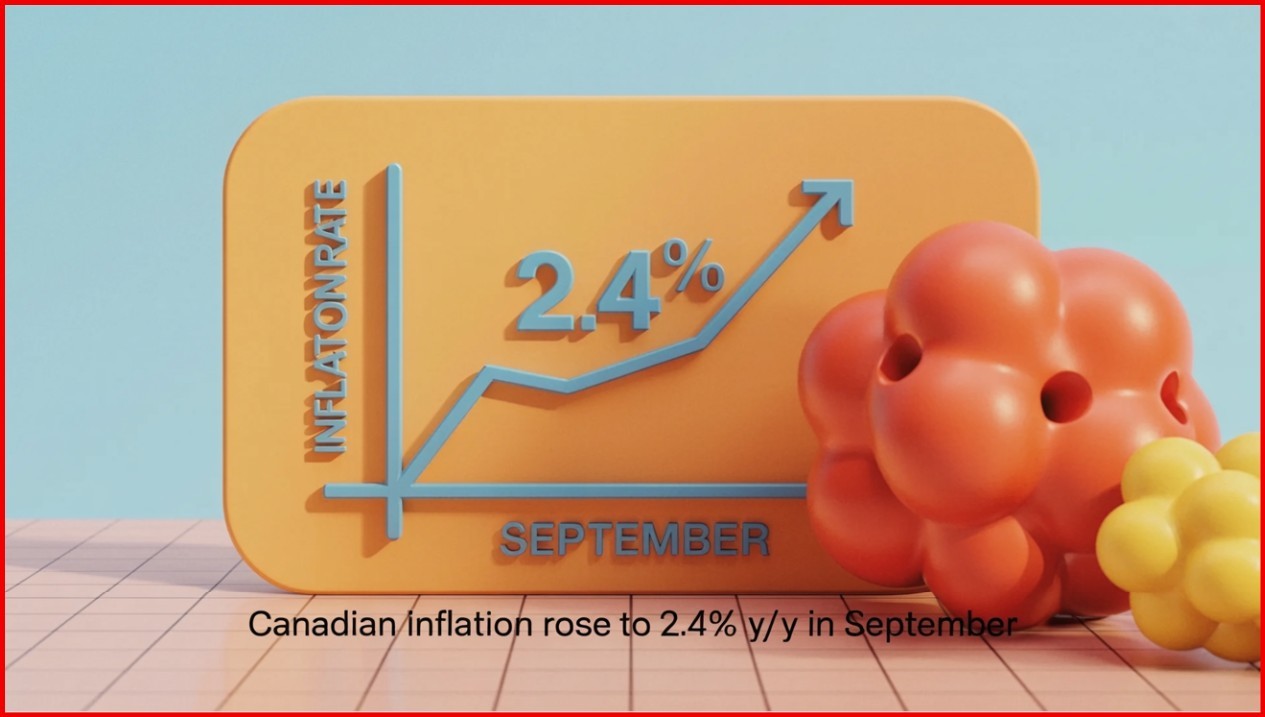
    The annual inflation rate in Canada rose to 1.9% in June from 1.7% in May, aligning with market expectations. Despite the pickup, the rate remained below the Bank of Canada’s mid-point target of 2% for the third consecutive month. 

    Headline inflation grew at a faster pace, as gasoline prices fell to a lesser extent in June (-13.4%) than in May (-15.5%). Additionally, faster price growth for some durable goods, such as passenger vehicles and furniture, put upward pressure on the CPI in June.

    Prices for food purchased from stores rose 2.8% year-over-year in June, following a 3.3% increase in May.

    Year over year, the CPI excluding energy (+2.7%) remained higher than the CPI in June, partly due to the removal of consumer carbon pricing in April.

    Monthly, the CPI rose 0.1% in June. On a seasonally adjusted monthly basis, the CPI was up 0.2%. 

    Today's Report Shows Inflation Remains a Concern, Forestalling BoC Action

    The Bank of Canada’s two preferred core inflation measures accelerated slightly, averaging 3.05%, up from 3% in May, and above economists’ median projection. The three-month moving annualized average of the core rates surged to 3.39%, from 3.01% previously.

    There’s also another important sign of firmer price pressures: The share of components in the consumer price index basket that are rising by 3% or more — another key metric the central bank’s policymakers are watching closely — expanded to 39.1%, from 37.3% in May.

    Today's Report Shows Inflation Remains a Concern, Forestalling BoC Action

    Bottom Line

    The chart below, created by our friends at Mortgage Logic News, shows that  Canadian economic data have come in stronger than expected on average in recent weeks. This was evident in the June employment report. As a result, the Bank of Canada is likely to remain on the sidelines on July 30 for the third consecutive meeting. The Canadian economy appears to be weathering the tariff storm better than expected, at least for now. 

    While we expect to see a negative print on Q2 GDP growth, a bounce back to positive growth in Q3 is also possible, precluding the much-expected Canadian recession.

    The June inflation data, released today for the US, was weaker than expected for the core price index. Declines in car prices helped mitigate tariff-related increases in other goods within the US consumer basket.

    The US inflation data could draw even greater calls from President Trump for the Federal Reserve to lower interest rates. While some officials have expressed a willingness to cut rates when the central bank meets in two weeks, policymakers are generally still divided as to whether tariffs will cause a one-time price shock or something more persistent. They will leave rates unchanged for now.

    Today's Report Shows Inflation Remains a Concern, Forestalling BoC Action

    Dr. Sherry Cooper

  • E-Commerce Essentials: Building Your Online Empire From the Ground Up

    E-Commerce Essentials: Building Your Online Empire From the Ground Up

    The digital marketplace isn’t just booming—it’s evolving at breakneck speed. For entrepreneurs, understanding core E-Commerce principles is no longer optional; it’s the lifeline of sustainable growth. From seamless checkout flows to mobile-first design, every detail shapes customer loyalty. Yet many startups focus solely on products, neglecting the engine that drives visibility: strategic Digital Marketing.

    Why Your E-Commerce Foundation Determines Everything

    A stunning website means nothing if visitors bounce. Successful E-Commerce hinges on three pillars: intuitive navigation, frictionless payments, and lighting-fast load times. Think of Amazon’s “1-Click” ordering—convenience converts. Mobile optimization isn’t a bonus; 79% of shoppers use smartphones to buy. Ignore this, and you ignore your largest audience.

    Digital Marketing: The Fuel for E-Commerce Growth

    Once your store is airtight, Digital Marketing ignites traffic. Targeted Facebook ads, SEO-optimized product descriptions, and email retargeting turn browsers into buyers. Consider how Dollar Shave Club’s viral videos catapulted sales—clever content cuts through noise. But remember: platforms change. Algorithm updates can tank visibility overnight. Agility is key.

    Scaling Your Operation Sustainably

    Growth brings chaos without systems. Inventory management tools, automated CRM emails, and data analytics prevent profit leaks. Take inspiration from this analysis of explosive retail expansion in “Move Over, Starbucks and McDonald’s – This New Company Has More Stores Than You Think“. The lesson? Infrastructure must outpace ambition.

    E-Commerce mastery blends art and science—but you don’t need to navigate it alone. For tailored strategies that convert traffic into revenue, explore resources at riskfreestartup.com. When ready to elevate your online presence, MorningLee.ca delivers data-driven consulting for startups aiming to dominate their niche.

    E-Commerce Essentials: Building Your Online Empire From the Ground Up

  • The 4 Undeniable Pillars of Modern E-Commerce Success (And Why Most Brands Ignore Them)

    The 4 Undeniable Pillars of Modern E-Commerce Success (And Why Most Brands Ignore Them)

    E-commerce isn’t just about listing products online—it’s a high-stakes chess game where strategy separates winners from bankruptcy statistics. Yet, 73% of online stores fail because they chase tactics, not systems. The solution? Mastering four non-negotiable pillars that transform visitors into loyalists. Let’s dismantle myths and rebuild your playbook.


    Pillar #1: Strategic Advertising – The Engine of E-Commerce Growth

    Forget spray-and-pray campaigns. Profitable E-commerce advertising demands surgical precision:

    • Hyper-Targeted Visual Storytelling: Top performers (like luxury skincare brands) blend Photoshop-enhanced visuals with TikTok/Reels snippets to showcase product textures and results—cutting through scroll fatigue.
    • Platform-Specific Psychology: Instagram users crave aesthetics; Facebook shoppers want deals. One brand boosted conversions by 210% by reformatting its Facebook carousel ads into Instagram Reels with K-pop trending sounds1.
    • Profit-First Budget Allocation: Startups waste 68% of ad spend by ignoring channel profit margins. Rule: Allocate 50% to top-performing channels (usually paid social), 30% to emerging platforms (TikTok Shop), and 20% to retargeting3.

    Pillar #2: Email Marketing – The Retention Backbone of E-Commerce

    Email generates $42 for every $1 spent—but only if you move beyond discount blasts. Modern flows leverage:

    • Behavioral Triggers: Abandoned cart? Send a product demo video in your email. Post-purchase? Deliver UGC-style care tips (e.g., “How to extend the life of your vegan leather tote”).
    • Segmented Story Arcs: Luxury brands like Maison de Sabré use 12-email “serialized stories” for high-ticket items—boosting repeat purchase rates by 33%3.
    • AI-Powered Send Times: Tools like Klaviyo sync emails to individual open-time peaks (e.g., 10:42 AM for Jane vs. 8:17 PM for Raj).

    Pillar #3: Organic Social & Influencer Impact on E-Commerce Credibility

    Digital Marketing authenticity is currency. Xiaohongshu (Little Red Book) proves this: brands using “unfiltered review collabs” (where influencers disclose flaws) see 3× more trust-driven sales1. Keys:

    • Micro-Influencer “Squads”: Partner with 5–10 nano-influencers (1K–10K followers) for a coordinated theme (e.g., #SustainableSaturdays). Their collective reach rivals macro-influencers at 1/10 the cost.
    • Content Repurposing: Turn their UGC into ads, product page banners, and email social proof—slashing content production costs by 60%.

    Pillar #4: SEO – The Long-Term Growth Lever

    Google processes 8.5B searches daily—but E-commerce SEO now demands more than keywords:

    • Voice Search Optimization: 55% of teens use voice shopping. Optimize for long-tail phrases like “Where can I find fragrance-free sunscreen for sensitive skin?” with concise FAQ schema markup.
    • Visual Search Integration: Tools like Syte.ai let users search your catalog via uploaded images (e.g., “Find dresses similar to this influencer’s outfit”).
    • Analytics Alignment: Sync Adobe Analytics with Power BI dashboards to track SEO’s impact on lifetime value—not just traffic. One brand discovered its “long-tail keyword” segment had 4× higher LTV than branded traffic2.

    Why These Pillars Fail Without Synergy

    A luxury watch brand doubled traffic via SEO (Pillar #4) but had a 0.2% conversion rate. Diagnosis? Their email flows (Pillar #2) didn’t nurture SEO visitors with tailored content. The fix:

    • Created a “Watch Care Masterclass” email series for SEO-acquired users.
    • Retargeted email engagers with ads featuring influencer unboxing videos (Pillars #1 + #3).
    • Result: 17% conversion lift within 8 weeks.

    Data Point: Companies unifying these pillars see 360% higher customer retention versus single-channel tactics3. Yet, execution requires ruthless prioritization—a challenge for resource-strapped teams.

    This is where MorningLee.ca intervenes. We embed these pillars into your operations through battle-tested frameworks—like our “E-commerce Growth Matrix”—that align ads, email, organic, and analytics into a profit-printing engine. No theory. Just trackable revenue lifts.

    Overwhelmed by piecemeal tactics? See how unified systems drive profit in unexpected industries—even coffee and burgers:
    👉 Move Over, Starbucks and McDonald’s – This New Company Has More Stores Than You Think

    Ready to transform your E-commerce chaos into clarity?
    🔗 Build Your Pillars Here with MorningLee.ca’s consultancy—where data meets decisiveness.

    For more E-Commerce information, please visit WealthDao Consulting

    For Business Consulting, please contact us

    The 4 Undeniable Pillars of Modern E-Commerce Success (And Why Most Brands Ignore Them)
  • Stock, Real Estate, or Gold? Choose the Right Investment!

    Building wealth often involves navigating a landscape of diverse assets. Stocks, real estate, and gold represent three fundamentally different investment avenues, each with unique characteristics, risks, and rewards. Choosing between them – or, more wisely, blending them – requires understanding their core strengths and weaknesses. Let’s break down the pros and cons of each.

    1. Stocks: The Engine of Growth & Ownership

    • What it is: Buying shares representing fractional ownership in publicly traded companies.
    • Core Appeal: Capital appreciation (growth) and income (dividends).
    • Pros:
      • High Growth Potential: Historically, stocks offer the highest long-term return potential among the three, driven by economic growth and corporate profits.
      • High Liquidity: Easily bought and sold during market hours. Access your capital quickly (price volatility notwithstanding).
      • Low Barrier to Entry: Start with small amounts (even fractional shares). No massive down payment needed.
      • Diversification: Easily spread risk across companies, sectors, and countries via mutual funds and ETFs.
      • Passive Income (Dividends): Many companies distribute regular cash dividends.
      • Relatively Hands-Off: Minimal ongoing effort required once invested (especially in funds). No physical maintenance.
      • Lower Transaction Costs: Brokerage commissions are typically very low (often $0).
    • Cons:
      • High Volatility: Prices can swing dramatically daily. Significant short-term losses are common. Emotionally challenging.
      • Market Risk: Entire portfolios can suffer during bear markets or recessions.
      • Company-Specific Risk: Individual stocks can plummet due to poor management, competition, or scandal.
      • No Tangible Asset: Ownership is digital/paper-based. No intrinsic utility.
      • Requires Research/Discipline: Successful investing demands knowledge, research, and emotional control to avoid panic selling or speculative buying.

    2. Real Estate: The Tangible Cash Flow & Leverage Play

    • What it is: Purchasing physical property (residential, commercial, land) for rental income, appreciation, or use.
    • Core Appeal: Steady income, potential appreciation, leverage, and inflation hedging.
    • Pros:
      • Tangible Asset: You own a physical, usable property (live in it, rent it out).
      • Steady Cash Flow: Rental income provides predictable monthly income (potentially covering expenses and generating profit).
      • Appreciation Potential: Property values generally rise over the long term, building equity.
      • Leverage: Use mortgages to control a large asset with a relatively small down payment (e.g., 20%), magnifying returns if values rise.
      • Inflation Hedge: Property values and rents often increase with inflation.
      • Tax Advantages: Significant benefits (mortgage interest deduction, depreciation, capital gains exclusions on primary homes).
      • Control: Direct influence over the asset (management, improvements, tenants).
    • Cons:
      • High Illiquidity: Selling takes significant time (weeks/months) and incurs high costs (commissions, closing fees). Quick cash access is difficult.
      • High Barrier to Entry: Requires substantial capital for down payments, closing costs, repairs, and reserves.
      • High Transaction Costs: Buying/selling involves hefty fees (realtor commissions ~5-6%, plus others).
      • Management Intensive: Demands active effort (finding tenants, repairs, rent collection) or costly property management fees (~8-12% of rent).
      • Ongoing Expenses: Property taxes, insurance, maintenance, repairs, HOA fees, and vacancies are constant drains.
      • Concentration Risk: A single property represents a large chunk of your net worth. Diversification is expensive.
      • Leverage Risk: Magnifies losses if property values decline. Negative cash flow is possible.

    3. Gold: The Ancient Store of Value & Safe Haven

    • What it is: Investing in physical gold (bullion, coins) or gold-related securities (ETFs, mining stocks).
    • Core Appeal: Preservation of capital, portfolio diversification, hedge against uncertainty/inflation.
    • Pros:
      • Safe Haven: Historically performs well during periods of market turmoil, geopolitical instability, and high inflation (“flight to safety”).
      • Portfolio Diversifier: Often has low or negative correlation to stocks and bonds, potentially smoothing overall portfolio returns.
      • Tangible Asset (Physical): Physical gold is a real, finite commodity you can hold (store securely!).
      • Store of Value: Maintains purchasing power over very long periods (centuries). Hedge against currency devaluation.
      • No Counterparty Risk (Physical): Doesn’t rely on a company’s performance or a borrower’s ability to pay (like stocks or bonds).
      • Liquidity (Certain Forms): Bullion and major ETFs are relatively easy to buy and sell globally.
    • Cons:
      • No Income: Gold generates no yield, dividends, or rent. Relies solely on price appreciation.
      • Low Long-Term Growth Potential: Historically, gold’s long-term returns lag significantly behind stocks and often real estate. It’s primarily a preserver, not a grower.
      • Volatility: While a safe haven, gold prices can still be volatile in the short-to-medium term.
      • Storage & Insurance Costs (Physical): Securely storing physical gold (safes, vaults) and insuring it incurs ongoing expenses.
      • No Intrinsic Cash Flow: Unlike businesses (stocks) or properties (real estate), gold doesn’t produce anything valuable on its own.
      • Potential High Premiums (Physical): Buying/selling physical coins/bars often involves significant markups over the spot price.
      • Tax Treatment (US): Often taxed as a “collectible” (higher capital gains rate than stocks) in the US.

    Side-by-Side Comparison:

    FeatureStocksReal EstateGold (Physical)
    Core PurposeGrowth, Income (Dividends)Income, Appreciation, LeveragePreservation, Safe Haven
    Growth Pot.High (Long-Term)Moderate-High (Leveraged)Low (Long-Term)
    IncomeYes (Dividends)Yes (Rent)No
    LiquidityHighLowModerate (ETFs High)
    Barrier EntryLowHighModerate (ETFs Low)
    TangibilityNoYesYes
    VolatilityHighModerate (Value), High (Leverage)Moderate-High
    ManagementLow (Passive)High (Active)Low (Hold) / Mod (Storage)
    LeverageLimited/Risky (Margin)Yes (Mortgages)No
    Inflation HedgeModerate (Depends on company)StrongStrong (Historically)
    DiversificationHigh (Easy)Low (Per Property)High (Low Correlation)
    Key RiskMarket Volatility, Company FailureIlliquidity, Leverage, VacanciesStagnation, Storage Costs

    Alternatives & Blends:

    • REITs (Real Estate Investment Trusts): Offer real estate exposure with stock-like liquidity and dividends. Pros: Liquidity, Diversification, Income. Cons: Stock-like volatility, No direct control/leverage, Different tax treatment.
    • Gold ETFs: Track the gold price. Pros: High liquidity, No storage hassle, Low entry. Cons: Counterparty risk (fund issuer), Expense ratios, Not physical.

    Which One (or Blend) is Right For You? Ask Yourself:

    1. Time Horizon: Long-term growth? (Stocks). Medium-term income? (Real Estate). Short-term safety? (Gold).
    2. Risk Tolerance: High volatility okay? (Stocks). Comfortable with leverage/illiquidity? (Real Estate). Prefer stability? (Gold).
    3. Capital Available: Limited? (Stocks/Gold ETFs). Substantial? (Real Estate/Physical Gold).
    4. Desired Involvement: Hands-off? (Stocks/Gold ETFs). Hands-on? (Direct Real Estate). Passive holder? (Physical Gold).
    5. Income Needs: Need regular cash flow? (Real Estate/Dividend Stocks). Focused on long-term value? (Gold/Growth Stocks).
    6. Market Outlook: Concerned about inflation/instability? (Gold/Real Estate). Confident in economic growth? (Stocks).

    Conclusion: Diversification is Key

    Stocks, real estate, and gold serve distinct purposes in a portfolio:

    • Stocks are your primary engine for long-term wealth growth.
    • Real Estate offers tangible assets, leverage, and steady income, but demands capital and management.
    • Gold acts as a portfolio stabilizer, a preserver of capital during crises, and an inflation hedge.

    There is no single “best” investment. The optimal strategy typically involves a diversified blend tailored to your specific goals, risk tolerance, time horizon, and resources. Stocks provide growth potential, real estate offers income and leverage, and gold brings stability and diversification. Understanding the unique pros and cons of each empowers you to build a resilient portfolio designed to weather different market conditions and achieve your financial objectives.

    Resources

    More information about Morning Lee services, please go to our blog: https://morninglee.ca/realestate-mortgage-business/

    Consulting: https://WealthDaoConsulting.com

    Risk Free Startup Success: https://RiskFreeStartup.com

    Real Estate Due Diligence: https://EstateDetect.com

    Turn Network to Profit: https://Net2Profit.com

    Real Estate Sign Installation: https://Sign2Sold.com

Oh hi there 👋 It’s nice to meet you.

Sign up to receive market updates, news, policies, skills, information, knowledge, post updates

We don’t spam! Read our privacy policy for more info.