Category: Real Estate – Market, Policies, Skills, News, Analysis
Buy Residential Property in Vancouver, Residential Real Estate, Single Family Home, Single House, Town House, Town Home, Apartment, Condo, Duplex, Triplex, Fourplex, Best Vancouver Realtor, Best Vancouver Real Estate Agent
Buy Commercial Property – Commercial Real Estate – Commercial Realtor – Commercial Real Estate Agent
Warehouse, Industrial, Office, Retail Store, Farm, Hotel, Multi Family Building, Land Assembling, Developing Land, Church, Island, Commercial Building
Sell Commercial Property – Vancouver Commercial Realtor, Vancouver Commercial Real Estate Agent
Warehouse, Industrial, Office, Retail Store, Farm, Hotel, Multi Family Building, Land Assembling, Developing Land, Church, Island, Commercial Building, Motel
Sell Residential Property in Vancouver – Best Realtor in Vancouver – Vancouver Realtor – Vancouver Real Estate Agent
Residential Real Estate, Single Family Home, Single House, Town House, Town Home, Apartment, Condo, Duplex, Triplex, Fourplex
The 3-year fixed rate has hit a new low at 3.69%, but the 5-year lowest fixed rate has gone up. The upward and downward pressures are still fiercely competing.
If you are considering a loan in the near future, you need to pay close attention to rate changes and seize the timing to lock in a contract that is favourable to you.
If your current rate is relatively high, 5% or even over 6%, you need to carefully calculate and compare: the penalty for breaking your current contract versus the money saved by switching to a lower rate — which one is more cost-effective. An extra surprise may even make you scream!
Even banks say no, for low income, low credit, low down pay, Morning will find a way, for you.
Imagine Investor A, holding seven properties with a total value $10+ million. They spot a rare opportunity: sellers urgently offloading prime real estate at below-market price. But when they approach traditional banks for a loan, they hit a wall.
The Dilemma Despite looking like a financial winner, reality bites:
Self-employment income nearly zero due to market changes
Rental income covers mortgage with positive cash flow, but after daily expenses and maintenance, disposable cash is limited
Excellent credit score and history
Yet, major banks refused their applications. Why? Income too low, debt too high, and unable to pass standard stress tests.
Breaking the Gridlock Investor A came to us, and we break it through by thinking differently. While banks focus on regular income, we realized Investor A’s wealth was “locked in walls.” Six solutions emerged by us:
1. Reverse Mortgage (Primary Residence, Age 55+)
Benefits:
No income verification.
Flexible credit requirements.
No down payment required.
Access up to ~50% of your home equity.
Funds received as monthly payments, lump sum, or instalments.
Minimal fees, almost none.
Fast approval.
Drawbacks:
Only available for primary residences (not investment properties).
Maximum Cash Available: ~$1 million
2. “Enhanced” Reverse Mortgage (Primary Residence, No Age Requirement)
Benefits:
No age requirement.
No income verification.
Flexible credit requirements.
No down payment required.
Access up to 60% of your home equity.
Funds received as monthly payments, lump sum, or instalments.
Fast approval.
Cancel anytime without penalty.
Drawbacks:
Only available for primary residences (not investment properties).
Higher fees.
Maximum Cash Available: ~$1.2 million
3. First Mortgage Home Equity Line of Credit
Benefits:
Access up to 75% of home equity.
No income verification.
No age requirement.
Flexible credit requirements.
Pay interest only on amounts drawn; no payment if unused. Access funds freely and flexibly.
Drawbacks:
Higher fees.
Requires terminating existing first mortgage.
Maximum Cash Available: ~$6 million
4. First Mortgage Home Equity Mortgage
Benefits:
Access up to 75% of home equity.
No income verification.
No age requirement.
Flexible credit requirements.
Lower fees than a First Mortgage HELOC.
Drawbacks:
Requires terminating existing first mortgage.
Monthly payments required.
Maximum Cash Available: ~$6 million
5. Second Mortgage Home Equity Line of Credit
Benefits:
No income verification.
No age requirement.
Flexible credit requirements.
Access up to 75% of home equity.
Pay interest only on amounts drawn; no payment if unused. Access funds freely and flexibly.
Does not require terminating existing first mortgage.
Drawbacks:
Higher fees.
Maximum Cash Available: ~$6 million
6. Second Mortgage Home Equity Loan
Benefits:
No income verification.
No age requirement.
Flexible credit requirements.
Access up to 75% of home equity.
Does not require terminating your existing first mortgage.
Lower fees than a Second Mortgage HELOC.
Drawbacks:
Monthly payments required.
Maximum Cash Available: ~$6 million
Investor A opted for a mix of all six, leveraging each solution’s strengths while minimizing drawbacks according to the banks policies and his own situation like title, balance, interest rate, etc .
The Result Investor A secured a $5 million credit line with two remarkable features:
Off loaded the cash pressure— and interest applies only when money is used
Ready to close good deals any time and immediate access to funds when needed – won’t miss any good opportunities to build up more wealth.
From nearly depleted cash reserves, Investor A now had millions ready to seize undervalued properties, paying cash instantly. No income verification, no stress tests, no mandatory monthly payments—like turning their property into a giant credit card that only charges when used.
Practical Impact Opportunities came faster than expected. Sellers in a slow market offered below-market prices with room to negotiate. While others waited for bank approvals, Investor A could pay in cash, creating a competitive edge. The secret wasn’t having money—it was unlocking dormant assets to capitalize on timing and market gaps.
Key Takeaway Banks have rules, but asset value is undeniable. When income-based paths fail, check the “walls” you’ve built—every brick could be emergency cash or a lever to unlock opportunities. Investor A’s transformation? From chasing bank loans to letting assets speak for themselves.
For buyers, sellers, or anyone navigating property financing, understanding alternative funding strategies can make the difference between watching opportunities slip away or seizing them confidently.
Today’s release of the July housing data by the Canadian Real Estate Association (CREA) showed good news on the housing front. Following a disappointing spring selling season, National home sales were up 3.8% in July from the month before, with Toronto seeing transactions rebound 35.5% since March. However, the total number of Toronto sales remains low by historical standards.
On a year-over-year basis, total transactions have risen 11.2% since March.
There is growing confidence that the Canadian economy will resiliently weather the tariff trauma. The Canadian dollar is up, and longer-term interest rates have edged downward in the past ten days. Traders are now anticipating a rate cut by the Federal Reserve in September.
Tuesday’s release of the Canadian CPI will provide another data point for the Bank of Canada. Economic growth has held up, in large part because much of the pain from tariffs has been confined to industries singled out for levies, including autos, steel and aluminum.
Shaun Cathcart, the real estate board’s senior economist, said, “With sales posting a fourth consecutive increase in July, and almost 4% at that, the long-anticipated post-inflation crisis pickup in housing seems to have finally arrived. The shock and maybe the dread that we felt back in February, March and April seem to have faded,” as people become less concerned about their future employment.
New Listings
New supply was little changed (+0.1%) month-over-month in July. Combined with the notable increase in sales, the national sales-to-new listings ratio rose to 52%, up from 50.1% in June and 47.4% in May. The long-term average for the national sales-to-new listings ratio is 54.9%, with readings roughly between 45% and 65% generally consistent with balanced housing market conditions.
There were 202,500 properties listed for sale on all Canadian MLS® Systems at the end of July 2025, up 10.1% from a year earlier and in line with the long-term average for that time of the year.
“Activity continues to pick up through the transition from the spring to the summer market, which is the opposite of a normal year, but this has not been a normal year,” said Valérie Paquin, CREA Chair. “Typically, we see a burst of new listings right at the beginning of September to kick off the fall market, but it seems like buyers are increasingly returning to the market.
There were 4.4 months of inventory on a national basis at the end of July 2025, dropping further below the long-term average of five months of inventory as sales continue to pick up. Based on one standard deviation above and below that long-term average, a seller’s market would be below 3.6 months, and a buyer’s market would be above 6.4 months.
Home Prices
The National Composite MLS® Home Price Index (HPI) was unchanged between June and July 2025. Following declines in the first quarter of the year, the national benchmark price has remained mostly stable since May.
The non-seasonally adjusted National Composite MLS® HPI was down 3.4% compared to July 2024. This was a smaller decrease than the one recorded in June.
Based on the extent to which prices fell off in the second half of 2024, look for year-over-year declines to continue to shrink in the months ahead.
Bottom Line
Homebuyers are responding to improving fundamentals in the Canadian housing market. Supply has risen as new listings surged until May of this year. Additionally, the benchmark price was $688,700, 3.4% lower than a year earlier. That decrease was smaller than in June, and the board expects year-over-year declines to continue shrinking, it said in a statement.
While many expect the Fed to ease in September, I’m not sure it will happen. The producer price index came in hotter than expected this week. Fed action will depend mainly on the personal consumption expenditures index (PCE), the Fed’s favourite measure of inflation, which will be out on August 29.
US stagflation worries have emerged with the release of the July employment report, which showed considerable weakness, enough to get the head of the Bureau of Labour Statistics fired. The likelihood of a BoC cut will increase if the Fed begins a series of easing moves as the administration is demanding.
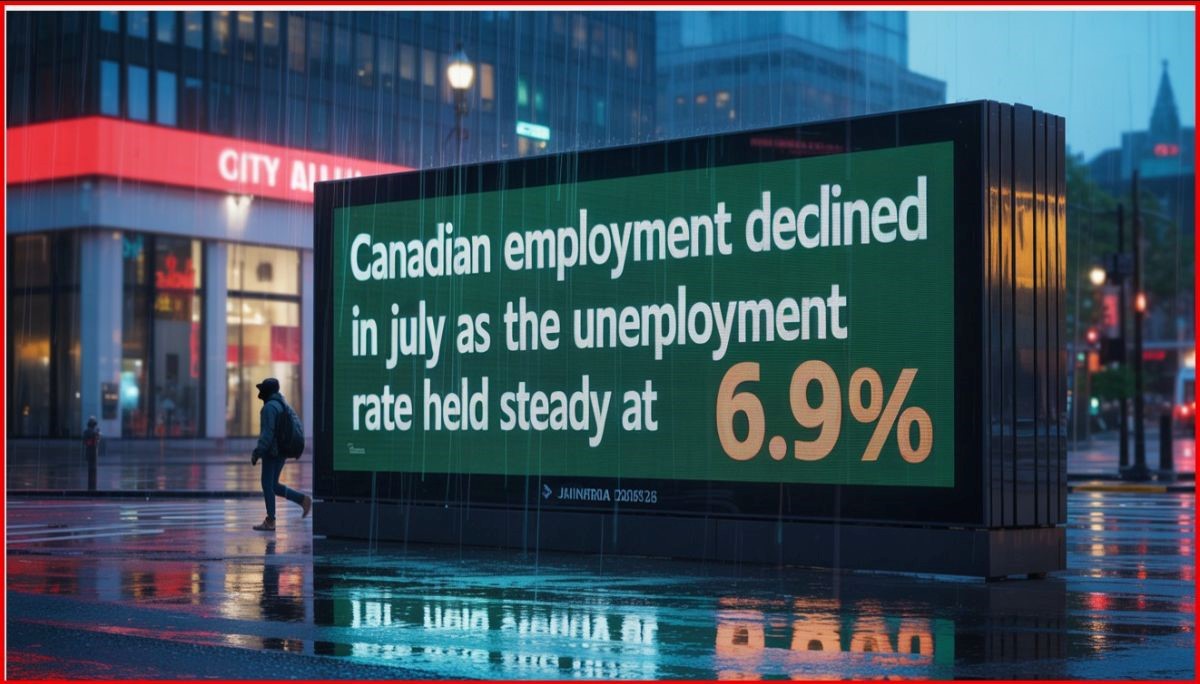
Canada’s July Labour Force Survey Was the Weakest Since 2022
Employment fell by 40,800 jobs in July, a weak start to the third quarter, driven by decreases in full-time work, with most of the decline in the private sector. The jobless rate held steady at 6.9%, even though the number of unemployed people fell. The monthly decline was the largest since January 2022, and excluding the pandemic, it’s the most significant drop in seven years.
The job loss was concentrated among youth ages 15 to 24 who have had a terrible time finding summer jobs this year. The unemployment rate for that group is a whopping 14.6%, the highest since September 2010 outside of the pandemic. The youth employment rate fell 0.7 percentage points to 53.6% in July—the lowest rate since November 1998, excluding the pandemic.
Trump’s tariff turmoil has halted so many crucial financial decisions. Potential homebuyers are deer-in-the-headlights despite the relatively low mortgage rates, strong supply of unsold homes, and lower prices. Potential move-up buyers similarly don’t take action despite the relatively strong bargaining power of buyers.
The employment rate—the proportion of the population aged 15 years and older who are employed—fell by 0.2 percentage points to 60.7% in July and was down 0.4 percentage points from the beginning of the year (61.1% in both January and February).
The number of employees in the private sector fell by 39,000 (-0.3%) in July, partly offsetting a cumulative gain of 107,000 (+0.8%) in May and June. There was little change in the number of public sector employees and in the number of self-employed workers in July.
The unemployment rate held steady at 6.9% in July, as the number of people searching for work or on temporary layoff varied little from the previous month. The unemployment rate had trended up earlier in 2025, rising from 6.6% in February to a recent high of 7.0% in May, before declining 0.1 percentage points in June.
Unemployed people continued to face difficulties finding work in July. Of the 1.6 million people who were unemployed in July, 23.8% were in long-term unemployment, meaning they had been continuously searching for work for 27 weeks or more. This was the highest share of long-term unemployment since February 1998 (excluding 2020 and 2021).
Compared with a year earlier, unemployed job seekers were more likely to remain unemployed from one month to the next. Nearly two-thirds (64.2%) of those who were unemployed in June remained unemployed in July, higher than the corresponding proportion for the same months in 2024 (56.8%, not seasonally adjusted).
Despite continued uncertainty related to tariffs and trade, the layoff rate was virtually unchanged at 1.1% in June compared with a year ago (1.2%). This measures the proportion of people who were employed in June but were laid off in July. In comparison, the layoff rate for the corresponding months from 2017-19, before the pandemic, averaged 1.2%.
There were fewer people in the labour force in July as many discouraged workers dropped out, and the participation rate—the proportion of the population aged 15 and older who were employed or looking for work—fell by 0.2 percentage points to 65.2%. Despite the decrease in the month, the participation rate was little changed on a year-over-year basis.
Despite continued uncertainty related to tariffs and trade, the layoff rate was virtually unchanged at 1.1% in July compared with 12 months earlier (1.2%). This represents the proportion of people who were employed in June but had become unemployed in July as a result of a layoff. In comparison, the layoff rate for the corresponding months from 2017 to 2019, before the pandemic, averaged 1.2% (not seasonally adjusted).
There were fewer people in the labour force in July, and the participation rate—the proportion of the population aged 15 and older who were employed or looking for work—fell by 0.2 percentage points to 65.2%. Despite the decrease in the month, the participation rate was stable on a year-over-year basis.
Employment declined in information, culture and recreation by 29,000 (-3.3%). In construction, employment decreased by 22,000 (-1.3%) in July, following five consecutive months of little change. The number of people working in construction in July was about the same as it was 12 months earlier.
Employment fell in business, building and other support services (-19,000; -2.8%), marking the third decline in the past four months for the industry. Employment also fell in health care and social assistance (-17,000; -0.6%), offsetting a similar-sized increase in June. Compared with 12 months earlier, employment in health care and social assistance was up by 54,000 (+1.9%) in July.
Employment rose in transportation and warehousing (+26,000; +2.4%) in July, the first increase since January. On a year-over-year basis, employment in this industry was little changed in July.
The number of jobs declined in Alberta (-17,000; -0.6%) and British Columbia (-16,000; -0.5%), while it increased in Saskatchewan (+3,500; +0.6%). There was little change in the other provinces. Total hours worked in July were little changed both in the month (-0.2%) and compared with 12 months earlier (+0.3%).
Average hourly wages among employees increased 3.3% (+$1.17 to $36.16) on a year-over-year basis in July, following growth of 3.2% in June (not seasonally adjusted).
Employment also declined in May in transportation and warehousing (-16,000; -1.4%); accommodation and food services (-16,000; -1.4%), and business, building and other support services (-15,000; -2.1%).
Bottom Line
The two-year government of Canada bond yield fell about four bps on the news, while the loonie weakened. Traders in overnight swaps fully priced in a quarter-point rate cut by the Bank of Canada by year-end, and boosted the odds of a September cut to about 40%, from 30% previously.
Oddly enough, manufacturing payrolls rose in July despite the tariffs. This was the second consecutive monthly gain for a sector that one would expect to be most affected by the trade war. Manufacturing employment has fallen year-over-year.
This was an unambiguously weak report, but it comes hard on the heels of a robust report. Averaging the two months of data suggests there is an excess supply in the economy. But we will need to see a decline in core inflation for the Bank of Canada to resume cutting interest rates.
Traders are now expecting the US central bank to cut interest rates when it meets again in September. With any luck at all, this will pressure the Bank to cut rates as well, but only if the interim two inflation reports show an improvement, and the labour market remains weak. The next jobs report is on September 5, and the Bank of Canada meets again on September 17.
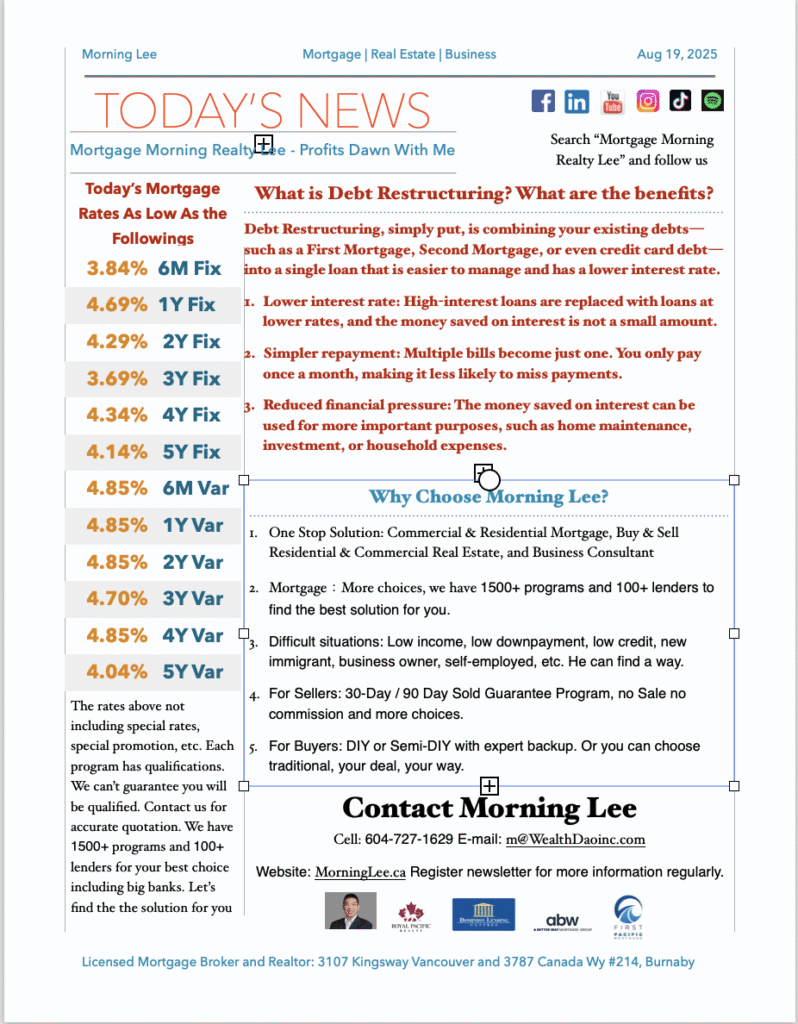
When you’re juggling multiple loans and high-interest debts, Debt Restructuring can be the financial strategy that brings relief—and significant savings. For many homeowners and buyers in the Vancouver real estate market, understanding how to restructure debt is not just about reducing monthly payments; it’s about creating long-term financial stability.
Debt Restructuring Explained
Debt Restructuring is the process of consolidating or reorganizing your existing debts—such as a first mortgage, second mortgage, or credit card balances—into a single, more manageable loan. This often means replacing high-interest debts with one loan at a lower rate, which can save you a substantial amount of money over time.
For example, instead of paying off several loans at different rates and due dates, you merge them into one loan with a fixed repayment plan. This simplifies budgeting, reduces stress, and helps avoid missed payments.
Case Study 1: First and Second Mortgage Consolidation
Imagine you have a first mortgage at 4.9% and a second mortgage at 9.5%. Paying these separately may feel manageable month-to-month, but over the long term, the extra interest on the second mortgage adds up quickly.
Through Debt Restructuring, you could merge both mortgages into a single loan at, say, 5.5%. While the new rate may be slightly higher than your first mortgage’s rate, it’s much lower than the second mortgage’s rate. The result: you pay less interest overall and simplify your repayment schedule.
Case Study 2: Adding Credit Card Debt to the Mix
Now let’s take it a step further. Suppose you have the same first and second mortgages, plus credit card debt at 19.9% interest. By consolidating all three into one restructured mortgage, you replace high-interest revolving debt with a lower fixed rate. This not only reduces your monthly payment but also helps you pay down your debt faster since more of your payment goes toward the principal rather than interest.
Why Debt Restructuring Matters for Real Estate Buyers and Sellers
If you’re a home buyer, debt restructuring can improve your credit profile, making it easier to qualify for better mortgage terms. For home sellers, clearing high-interest debt before listing your property may improve your financial flexibility, allowing you to handle closing costs or invest in home staging.
In a high-cost housing market like Vancouver, these savings can make the difference between feeling financially stretched and maintaining stability. For insights on broader market trends that affect borrowing costs, check out this recent report: Today’s Report Shows Inflation Remains a Concern, Forestalling BoC Action.
A Smart Move: Pair Debt Restructuring with Property Risk Checks
When you’re making big real estate decisions, understanding your financial position is only half the equation. It’s also important to understand the property you’re buying. Services like EstateDetect.com specialize in investigating potential risks and uncovering opportunities before you commit to a purchase, giving you peace of mind.
Final Thought: Debt Restructuring isn’t just a way to lower payments—it’s a long-term strategy for financial health. By learning how to consolidate loans effectively, you can save thousands in interest and simplify your path toward debt freedom. For more real estate and finance insights, visit MorningLee.ca.
This month I’ve put together a game of This or That for you. I’m challenging you to not only pick This or That, but also to think about why it’s the better course of action. After you’ve worked through the scenario, read on for the answer and explanation. And let me know how many you got right!
This or That: Underpricing or Overpricing Your Home?Underpricing is a common strategy in hot markets, since a lower asking price can attract multiple buyers and cause a bidding war. You could end up selling for more than the market value, just because of the demand.Overpricing deters buyers, your home sits on the market for longer, and it transfers the power to the buyer in negotiations. So, the clear winner is underpricing your home.
This or That: Selling in the Spring or Selling in the Fall?Selling in the spring means there are a lot more homes on the market at the same time, and typically an active time in the housing market. The US data shows homes sell for 1.6% more than the monthly average in the spring.Selling in the fall means less competition for sellers, and motivated buyers who want to be in a new place before the snow flies. Your real estate agent will also be less busy and can provide you more attention and better service. So, there’s no wrong answer here!
This or That: Professional Staging, Cleaning and Photography or DIY?Hiring a professional for every job takes time, coordination, and money – and gets great results. To determine if it’s the right move for you, consider how much more you’d be able to sell your home for. If the costs outweigh the benefits, it might be best to skip this step.However, don’t forget that pictures of your home are where potential buyers get their first impression of your home. Without good photos and an accessible environment for viewings, a great buyer might not be interested. This one is a toss up – consulting a neutral third party like your agent or neighbour might help you decide elements are needed and what you can do yourself. One pro tip I can offer you is to use ChatGPT (or Copilot, etc.) to help you with staging and décor – just put in the dimensions and ask for the ideal layout with your existing furniture.
This or That: Getting an Inspection Before or After Listing?If you get an inspection before you list, you’ll be able to get a full and unbiased review of your home. You can choose to fix any issues, or list as is with a clear picture of your home. You won’t be surprised or blindsided by a buyers’ inspection coming up with issues, you can list the property at the correct price, and you’ll be in the driver’s seat during negotiations.Letting the buyer have an inspection saves money but gives them the power to negotiate. The better course of action here is to inspect pre-listing.
This or That: Renovate to Increase Your Home’s Value or Leave As-is?Homeowners often complete expensive renovations before selling their home – but frequently don’t make their money back when selling. The new owners may have different tastes, or other plans for the layout or the home (including demolition!). Not only do renovations take time, but they may also require permits, inspections, or approvals. Overall, renovations before you sell are not financially beneficial.However, some repairs are critical to selling your home. Things like a leaking toilet or a hole in the drywall could easily deter a potential buyer and lower the value of your home. The best course of action here is to complete essential repairs so that the home is ready for immediate occupancy – but not spend money on extra renovations.
This or That: Using a Real Estate Agent or Listing For Sale By Owner (FSBO)?If you go the FSBO route, you take on all the stress and legal responsibility of research, showing, legal documentation and more. The main reason people choose this route is to save on the commission costs of selling a home.The benefits of using an agent are plentiful, like getting the pricing, staging and photography right. You can also rely on them for all the paperwork. If a plot twist comes up, they’re there to help. You can also benefit from having your home listed on their website and their social media accounts to get your property more visibility. The winner for the average person is to use an agent.
This or That: Requiring Notice in Advance or Showing Anytime?Keeping your home clean, tidy, and free of people and pets so that it’s ready for a showing is a real challenge for sellers if they’re living in the home they’re trying to sell. But for buyers who are already in the neighbourhood, inflexibility to view your home might discourage them from coming back. That means missed opportunities to sell and maybe even a lost sale.There isn’t a clear winner here, but being as flexible as possible with potential buyers creates the most opportunities for a sale.
This or That: Emotions and Instinct or Advice and Numbers?This might sound like an easy one – but not so fast! The highest bidder might not be the person you want to sell your home to. Imagine you received a thoughtful letter with an offer explaining how the buyer pictures raising their children in your home – vs more money from a developer who plans to raze the property.However, you need a cool head during important negotiations. A few issues are likely to be uncovered during the home inspection. No home is perfect, so don’t let a request for minor repairs derail the deal. The winner here is a balance of emotions and numbers – and each reader will need to find an equilibrium they can live with.
Bank of Canada Holds Rates Steady As Tariff Turmoil Continues
As expected, the Bank of Canada held its benchmark interest rate unchanged at 2.75% at today’s meeting, the third consecutive rate hold since the Bank cut overnight rates seven times in the past year. The Governing Council noted that the unpredictability of the magnitude and duration of tariffs posed downside risks to growth and lifted inflation expectations, warranting caution regarding the continuation of monetary easing.
Trade negotiations between Canada and the United States are ongoing, and US trade policy remains unpredictable.
While US tariffs are disrupting trade, Canada’s economy is showing some resilience so far. Several surveys suggest consumer and business sentiment is still low, but has improved. In the labour market, we are seeing job losses in the sectors that rely on US trade, but employment is growing in other parts of the economy. The unemployment rate has moved up modestly to 6.9%.
Inflation is close to the BoC’s 2% target, but evidence of underlying inflation pressures continues. “CPI inflation has been pulled down by the elimination of the carbon tax and is just below 2%. However, a range of indicators suggests underlying inflation has increased from around 2% in the second half of last year to roughly 2½% more recently. This largely reflects an increase in prices for goods other than energy. Shelter cost inflation remains the biggest contributor to CPI inflation, but it continues to ease. Surveys indicate businesses’ inflation expectations have fallen back after rising in the first quarter, while consumers’ expectations have not come down”.
The Bank asserted today that there are reasons to think that the recent increase in underlying inflation will gradually unwind. The Canadian dollar has appreciated, which reduces import costs. Growth in unit labour costs has moderated, and the economy is in excess supply. At the same time, tariffs impose new direct costs, which will be gradually passed through to consumers. In the current tariff scenario, upside and downside pressures roughly balance out, so inflation remains close to 2%.
The central bank provided alternative scenarios for the economic outlook. In the de-escalation scenario, lower tariffs improve growth and reduce the direct cost pressures on inflation. In the escalation scenario, higher tariffs weaken the economy and increase direct cost pressures.
So far, the global economic consequences of US trade policy have been less severe than feared. US tariffs have disrupted trade in significant economies, and this is slowing global growth, but by less than many anticipated. While growth in the US economy looks to be moderating, the labour market has remained solid. And in China, lower exports to the United States have largely been replaced with stronger exports to other countries.
In Canada, we experienced robust growth in the first quarter of 2025, primarily due to firms rushing to get ahead of tariffs. In the second quarter, the economy looks to have contracted, as exports to the United States fell sharply—both as payback for the pull-forward and because tariffs are dampening US demand.
The gap between the 2.75% overnight policy rate in Canada and the 4.25-4.50% policy rate in the US is historically wide. Another cause of uncertainty is the fiscal response to today’s economic challenges. The One Big Beautiful Bill has passed, and it will add roughly US$4 trillion to the already burgeoning US federal government’s red ink. This has caused a year-to-date rise in longer-term bond yields, steepening the yield curve.
The slowdown of the housing sector since Trump’s inauguration has been a substantial drain on the economy. The Monetary Policy Report (MPR) for July states that “growth in residential investment strengthens in the second half of 2025, partially due to an increase in resale activity after the steep decline in the first half of the year. Growth in residential investment is moderate over 2026 and 2027, supported by dissipating trade uncertainty and rising household incomes.”
Bottom Line
We expect the Canadian economy to post a small negative reading (-0.8%) in Q2 and (-0.3%) in Q3, bringing growth for the year to 1.2%. The next Governing Council decision date is September 17, which will give the Bank time to assess the underlying momentum in inflation and the dampening effect of tariffs on economic activity.
If inflation slows over the next couple of months and the economy slows in Q2 and Q3 as widely expected, the Bank will likely cut rates one more time this year, bringing the overnight rate down to 2.50%, within the neutral range for monetary policy. Bay Street economists have varying views on the rate outlook (see chart above). While the Fed will hold rates steady today, despite the incredible pressure coming from the White House, the Bank of Canada could well cut rates one more time this year.
Dr. Sherry Cooper Chief Economist, Dominion Lending Centres
If you’re looking to sell residential property in Vancouver, the timing may finally be shifting in your favour. After months of hesitation, the national housing market—particularly in key metros like Vancouver and Toronto—is showing signs of a turnaround. According to a July 2025 report from MorningLee.ca, both sales and price activity have begun to stabilize, hinting that we may be entering a more balanced and predictable phase of the market.
Let’s break down what this means for sellers in Vancouver, and why some property types might have a better window to sell than others.
1. Sell Residential Property inVancouver?Why This Could Be a Turning Point for Sellers
The latest data shows that home sales rose while prices held steady in June 2025. Nationally, sales were up around 3% month-over-month, and the national sales-to-new-listings ratio rose to 50.1%—a shift toward balanced market conditions.
In Vancouver, this means buyer activity is creeping back despite ongoing uncertainty like tariff threats and fluctuating interest rate expectations. As MorningLee.ca notes, market momentum may simply have been delayed by a rocky economic spring—and is now resurfacing into the summer and fall.
2. Sell Residential Property inVancouver?What It Means by Property Type: Not All Homes Are Equal
If you’re planning to sell residential property in Vancouver, it’s essential to understand how different home types are performing:
Single-family homes: Typically more sensitive to interest rate shifts and economic headlines, these properties may attract buyers looking for long-term stability—especially as price declines have moderated.
Townhouses and duplexes: Often appealing to move-up buyers or downsizers, these mid-density homes could benefit from stabilizing price expectations and a tighter sales-to-listings ratio.
Condos and apartments: While not explicitly broken down in the June report, condos tend to recover later in a cycle. Sellers should monitor interest rate moves closely, as affordability is a key factor for this segment.
If you’re unsure where your property stands in the cycle, now’s a good time to assess—not just emotionally, but strategically.
3.Sell Residential Property inVancouver?Should You List Now or Wait? A Seller’s Dilemma
The report points to cautious optimism, but also underlines continued risk: the Bank of Canada held rates steady, and bond yields have risen, suggesting fixed mortgage rates may go up again. These macro factors influence how quickly deals close, or if buyers even enter the market.
So who should act now?
Sellers of well-located, mid-priced homes in balanced neighborhoods may benefit from limited competition, as new listings fell 2.9% in June.
Sellers who’ve been holding off since early 2024 might consider testing the market before interest rate changes swing again.
But if your property type tends to lag in recovery cycles, or if buyer traffic is light in your area, patience may still be the better strategy. Either way, strategic timing is key—and understanding where the market cycle is headed will help you plan smarter.
The Bottom Line: Watch the Data, Move with Purpose
In a shifting market, data is your best friend. From price stabilization to listing trends, the latest report from MorningLee.ca offers a detailed pulse check on what’s real, what’s emerging, and what risks are still looming. Whether you’re a homeowner considering selling, a buyer looking to enter before rates rise, or someone navigating mortgage financing in a bumpy cycle—understanding these signals can make all the difference.
And before you make any move, make sure your property has no hidden red flags. Visit https://estatedetect.com to get an in-depth risk review before you buy or sell. Peace of mind is the best market strategy.